Is Investing in SPACs A Good Idea Again? (Was it Ever?)

Is Investing in SPACs A Good Idea Again? (Was it Ever?)

Is Investing in SPACs A Good Idea Again? (Was it Ever?)

Not that long ago, blank-check special purpose acquisition companies (SPACs) were all the rage on Wall Street.

In 2020 alone, there were 248 SPAC target IPO deals, with a whopping 613 of them coming the following year.

The market was hot!

How hot was it?

Well, the SPAC market was so blistering back in 2021, that the Wall Street journal did a full review on them titled, “SPACs Are the Stock Market’s Hottest Trend.”[1]

Bloomberg said, “SPACs were hot in 2020 and are hotter now.”[2]

Forbes did a full cover story calling them, “Wall Street’s Money Tree.”[3]

And on February 25, 2021, Jim Cramer, the prognosticator of prognosticators, picked five of them for his audience to invest in (more on this in a moment).[4]

But…

Things have changed. And they’ve changed a lot.

You see, while SPACS were a red-hot money tree back in 2021, recent data shows that the money tree no longer bears fruit, not even for the dealmakers.

Get this… So far this year, there have been just nine SPAC deals. Nine.

That’s a near 99% plummet in dealmaking since the heights of 2021.

But…

Just because the deal flow has slowed dramatically, that doesn’t mean SPACs haven’t been a good investment, right?

Well…

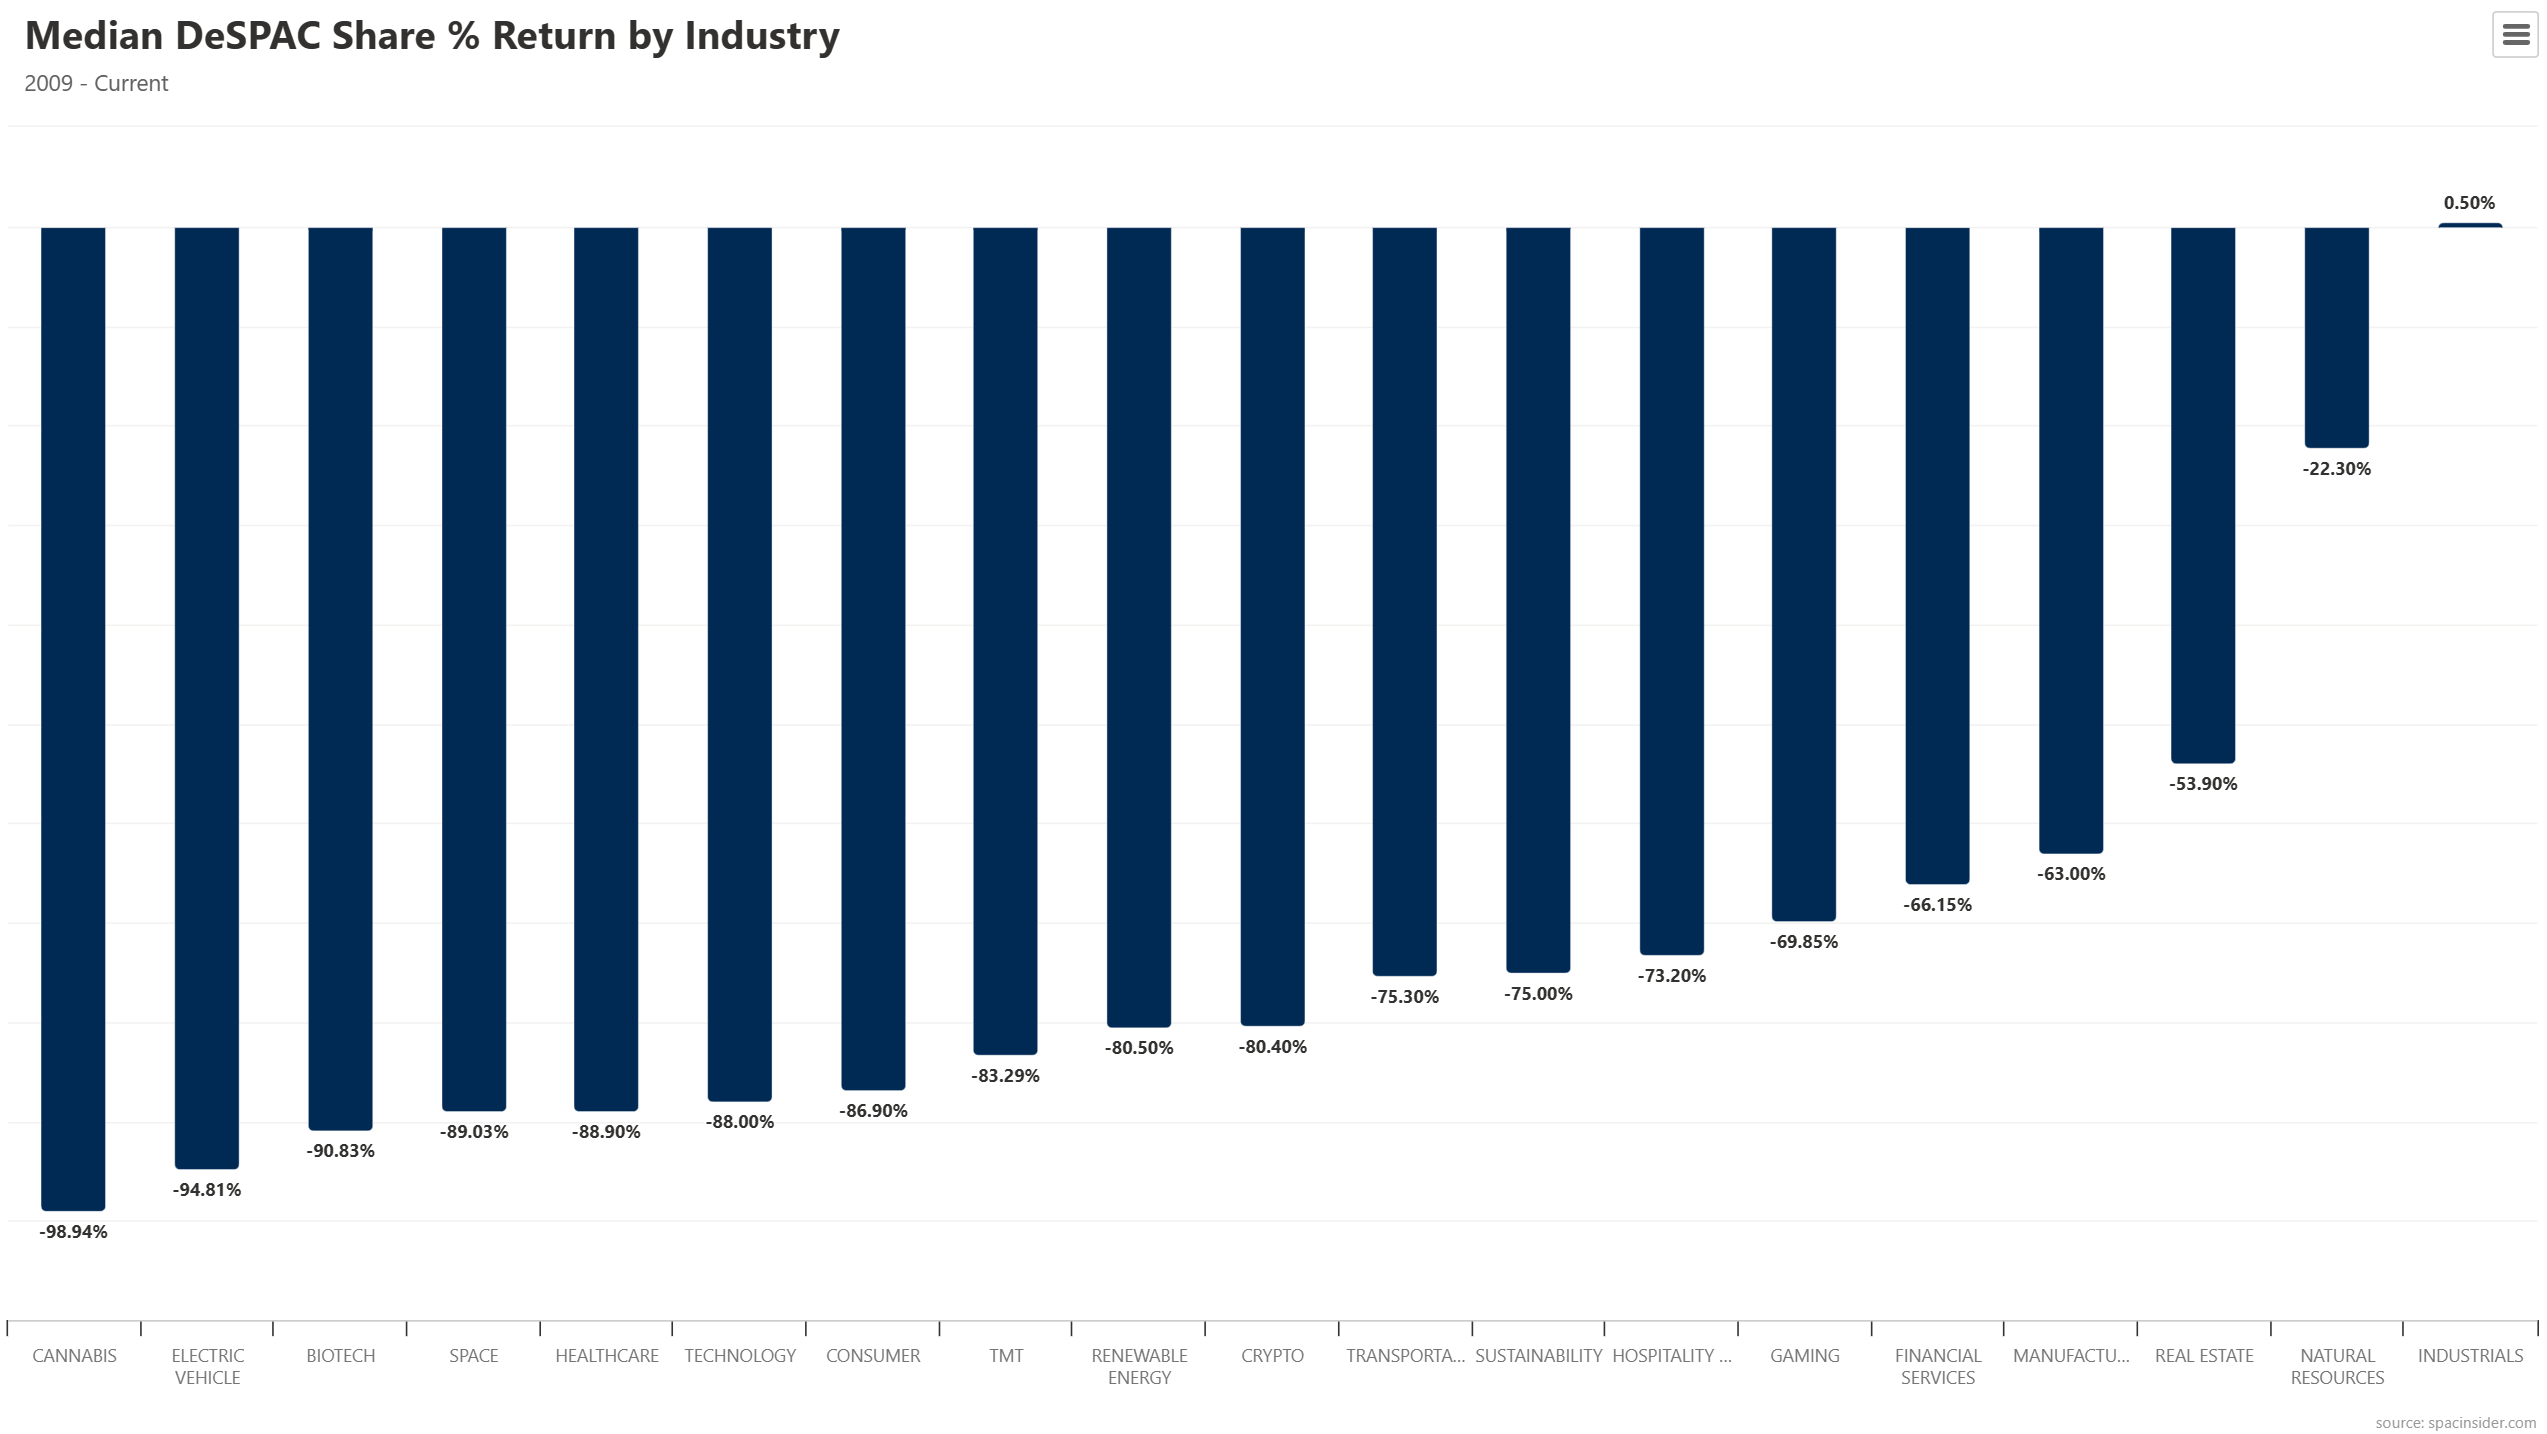
Have a look at this chart.

This chart comes to us from our friends over at SpacInsider.com. And it reveals the startling truth about SPACs.

They’ve been, for the most part, a horrible investment.

In fact, since 2009, the only sector with a median positive return has been Industrials, at just 0.5%.

And the worst performing industries? Cannabis and EVs. Down 99% and 95%, respectively.

Of course, there have been and still are some outliers, and actively trading SPACs could have produced, and may still produce decent returns for you…

But as a whole, investing in them for the long-term has been nothing short of horrendous. And the numbers prove it.

Speaking of the long-term…

Let’s have a look back at some of Jim Cramer’s SPAC picks he made for his audience on February 25, 2021, where he said…

“Here’s five new names, because I’m a slave to our viewers.”

Now, of the five picks he so generously shared with his audience, only one is trading higher today. And that’s Vertiv Holdings (VRT).

Vertiv’s stock is now trading (as of this writing) around $88, up from $20 when he made his call. This represents a very robust 340% gain.

But the good news and the good returns end there. And now, you may have guessed it…

His other four picks were bad, really bad!

SoFi (SOFI) went from $20 to its current $7. A 65% drop.

Open Lending (LPRO) went from $39 to $7… an 82% drop.

Skillz (SKLZ) went from $33 to $7, down 79%.

And…

AppHarvest (APPH) went from $33 to being delisted. Yes, delisted.

But let’s be clear, we’re not picking on Jim Cramer. Punching down on him is too easy. We’re simply pointing out how bad of a long-term investment SPACs, as a whole, have been…

And if history is any guide, they may continue to be.

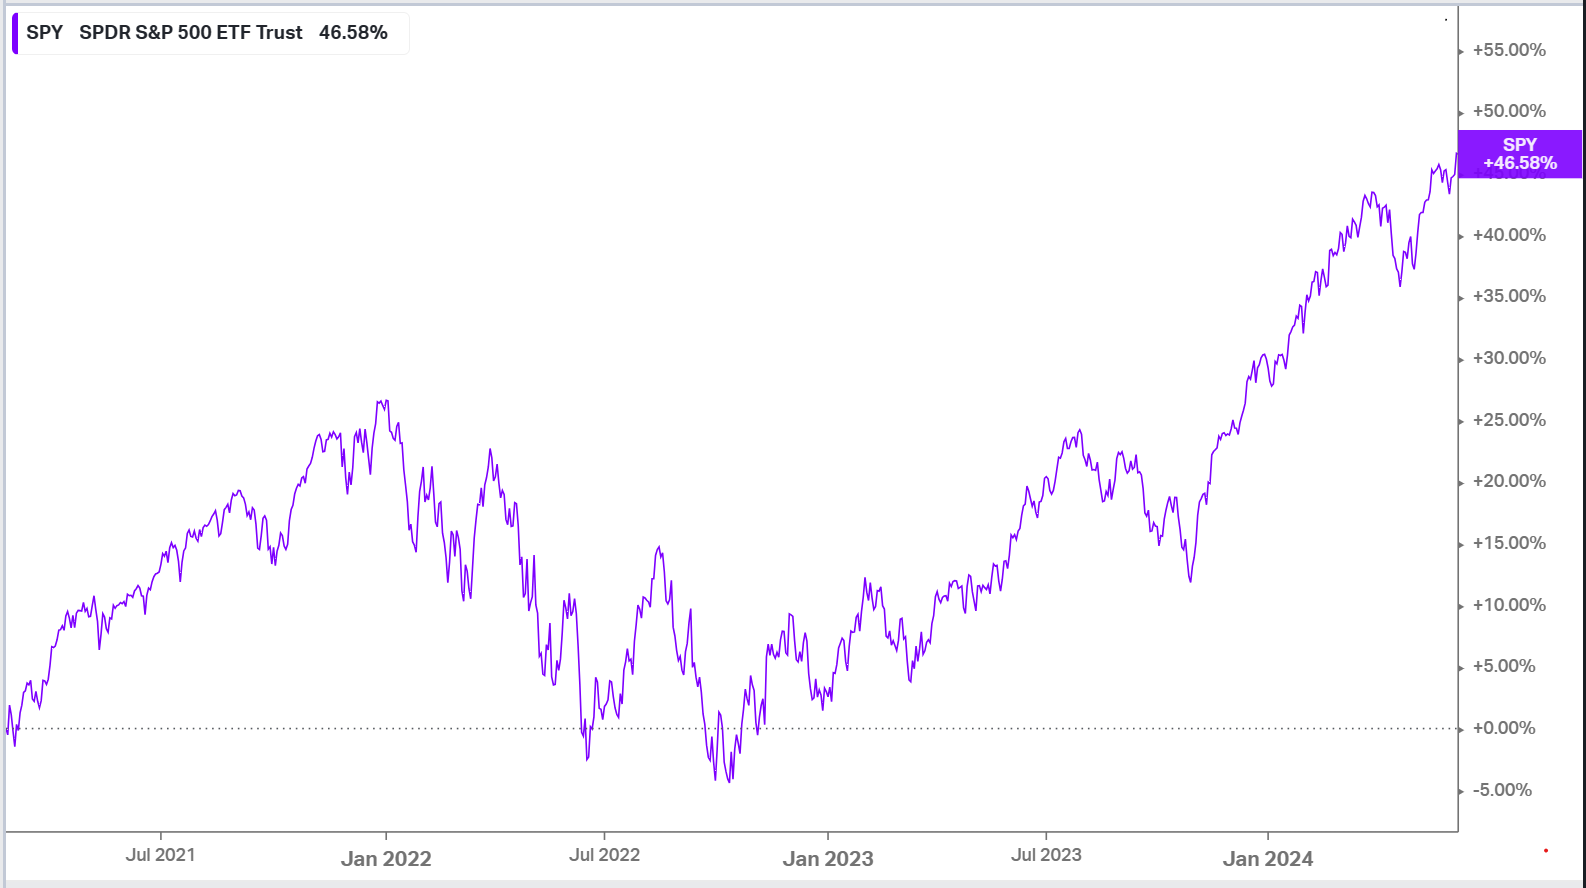
With that said, let’s have a look at this chart, shall we?

This shows the total returns of the SPDR S&P 500 ETF Trust since February 25, 2021. It begins on the same day Cramer made his SPAC picks.

Now, you don’t need to be an eagle-eyed genius to see that simply buying and holding SPY would have been a much better long-term investment than loading the boat with SPACs.

Because, even through the 2022 bear market where the S&P 500 shed 25%, holding SPY would still have resulted in total returns of over 46%.

That’s not bad. And it’s a heck of a lot better than the enormous SPAC losses exemplified by the SpacInsider.com chart.

So, there you have it. Beware of SPACs…

Beware of stock market prognosticators pitching anything that’s “hot” …

Invest your money wisely…

Use proper research…

And apply the tried and true market wisdom (and technology) offered by SentimenTrader.


[1] SPACs Are the Stock Market’s Hottest Trend. Here’s How They Work. – WSJ

[1] SPACs were hot in 2020 and are hotter now. Here’s why | Insights | Bloomberg Professional Services

[1] How Spacs Became Wall Street’s Money Tree (forbes.com)

[1] spacs “jim cramer” – Google Search

Stock Market Returns During Election Years

Stock Market Returns During Election Years

Stock Market Returns During Election Years

Turn on any cable news channel and you’ll be told, ad nauseam, that this is the single most important election in US history.

If candidate A doesn’t win, democracy is over…

If candidate B doesn’t win, the economy will be in shambles.

And your money? You can kiss it goodbye because X, Y, and Z will happen. It’ll definitely happen…

Fear sells.

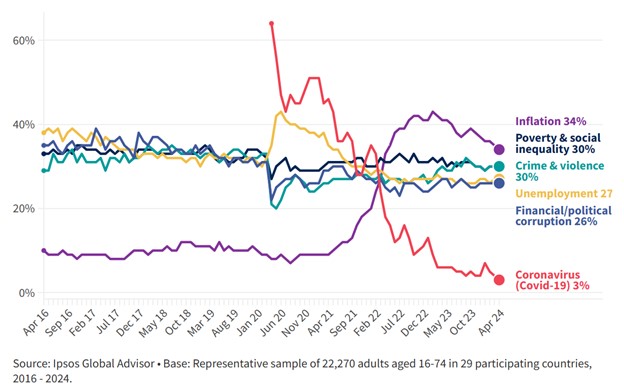
Have a look at this chart…

This chart, from Ipsos, shows various “fears” expressed by adults from 29 different countries. It spans nearly a decade, and it covers three US presidential election years, including this one.

With the exception of inflation, Coronavirus and its employment impacts, global fears have remained remarkably steady.

Now…

A strong case can be made that the widespread fear (campaigned on) during the Coronavirus election year led to the change in political control over America’s executive branch in 2020.

And a case could be made that widespread fears over inflation (campaigned on) could lead to another change in political control over our executive branch, this November.

Time will tell.

But even though fear can almost certainly sway voters in an election year…

Does the stock market care about elections, or election years?

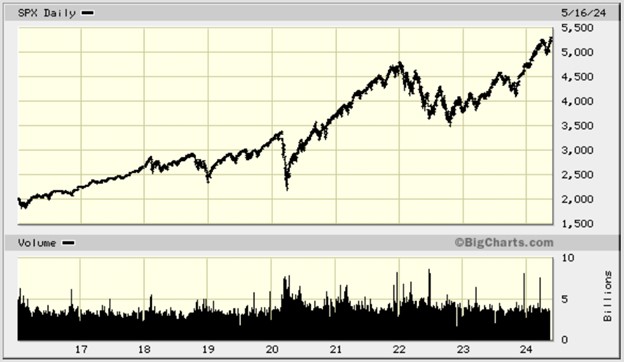
Have a look at this chart. It’s the S&P 500 covering the exact time period as the Ipsos fear chart.

Again, this covers almost ten years, with three of these years being election years.

During this timeframe, the S&P 500 gained over 140%.

Of course, this 3-election-cycle timeframe does not give us enough data to draw any sort of conclusions on whether the market cares about presidential election years, or not.


For that, we need more single-year data, and more time. So, let’s have a look.

Since 1928 there have been 24 presidential election years, excluding this one.

In 83% of those election years, stocks ended positively.

During the first half of each election year (which we’re in now) the market averaged a 2.78% gain.

During the second half of the election year, the market averaged a 9.34% gain.

Overall, the S&P 500 has returned an average of 11.57% during election years.

That’s pretty good, right?

Of course, the data is “averaged” over the course of 24 election years, so some years are better than others…

And because we’re averaging 24 years of gains and losses, it makes sense that the stock market’s performance is roughly in line with just about any other, ordinary year.

There are, however, some big outlier years.

Take for example, the election year of 1928, the S&P 500 gained 43.61%.

And let’s take the election year of 2008, the S&P 500 fell by 37%.

The market in both of these election years, you may recognize, was driven by economic and investor sentiment factors, and not by political hyperbole.

So… with 24 (going on 25) years of presidential election year data, we have enough information to reach an educated conclusion:

On average, during an election year, the market is… on average.

And the stock market doesn’t care about presidential elections.


Presidential Election Years Have Been Good for Investors (hartfordfunds.com)

How Presidential Elections Affect the Stock Market | U.S. Bank (usbank.com)

What does the election mean for the stock market? | Fidelity

Robot Birds, Model-Ts, & $70 Billion in FinTech

Robot Birds, Model-Ts, & $70 Billion in FinTech

Around 350 B.C.E, Pythagorean mathematician Archytas of Tarentum presented his friend Plato with a gift. On the outside, it looked simple enough. It was a wooden pigeon. 

But this was no simple, hand-carved bird.

You see, this seemingly ordinary-looking gift had something “magical” hidden inside it.

Archytas had carefully engineered and constructed an unseen internal mechanism that allowed his wooden pigeon to do something that perhaps no inanimate object created before it could do.

Its man-made wings could flap… without the assistance of the human hand. 

But what’s more, on its own, Archytas’ creation could, as legend has it, fly up to 650 feet through the air using a system of compressed air; or as some believe, an internal steam engine.

Archytas’ “magical” bird was one of the world’s first known automatons, or robots as we call them today. And with this revolutionary invention, backed by his Pythagorean mathematics, he ushered in the new science of mechanics and automation….

Which would eventually lead to artificial intelligence.

Now, fast forward to 1912, a quarter century after the invention of the automobile. A truly disruptive (yet remarkably simple) automation system was about to be unleashed.

This is a story of automation you’re probably familiar with; but it’s a story worth retelling.

Henry Ford had long been a multi-millionaire, operating the most successful automobile manufacturing business in America. In fact, in 1912 alone, Ford sold over 68,000 Model-T automobiles, nearly three-times the number of his closest competitor, Willys-Overland.[1]

But being number-1 in the automobile business was not good enough for Ford. No, he wanted more.

See, there were only so many consumers who could afford a $680 car – considering the average salary at the time, across all industries was about $700 a year – and only so many vehicles could be produced in a single day (on average it took about 12 hours to manufacture just one Model T).[2]

So, to truly become the king of the horseless-carriage, Ford would need to create a quick-to-produce vehicle within the financial reach of far more American consumers.[3] A product that was not only for the wealthy, but for the middle class as well.

And, as you know, he did it.

By 1925, the amount of time to produce a single vehicle dropped to just 90 minutes. Output increased to roughly 10,000 units a day (nearly 2 million came off the line that year), and the cost of a Ford vehicle had fallen to as low as $260 (while average US wages had nearly tripled).[4][5]

In his lifetime, Henry Ford had sold an estimated 19 million automobiles, and had accumulated an astounding net worth of $200 billion in today’s money.

And it was all thanks to Ford’s implementation of a truly disruptive technology he began using in 1913…

The moving assembly line. It was one of the simplest, yet most impactful industrial automations in our history. A machine-driven chain line that’s still in use today.

But the story of automation does not end with Henry Ford.


The Future of Automation, Ai

Just as Ford’s implementation of automation systems a century ago had rapidly and efficiently increased production of, and reduced the cost of his vehicles, today’s automation systems are doing the same across nearly every industry.

You’d be hard pressed to find any manufacturer, of any product, that does not use at least basic automation on their production lines. And, in fact, over 50% of all businesses have gone a step further and are using artificial intelligence tools in at least some capacity.[6]

Now, before we discuss Ai, especially one of its exciting uses in finance, we should address the current state of fear.

For over a century now there has been anxiety among the global workforce that “robots” will be taking human jobs. And these fears are widespread.

When you conduct a simple Google search for “are robots taking over jobs,” you’ll see an astounding 33 million results pages. The fear is that great.

Clearly this is a concern. But while some jobs will undoubtedly go the way of the dodo, the fear itself may be misplaced.

You see, as we mentioned earlier, between 1913 and 1925 the average salary for all US workers actually increased nearly threefold; this, as many US industries began adopting automation techniques.  

But what’s more…

In an interview with CBS News, Dr. Yosef Sheffi, an MIT engineering professor said of Ford’s industrial automation, “cars became less expensive, people started driving, we started having highways, hotels, motels, restaurants. The whole hospitality industry developed. Millions of jobs!”[7]

That was true then… but modern times are different, right? The 33 million Google results prove it.

Well, not so fast.

A recent Deloitte study on automation’s impact in the UK did reveal that 800,000 low-skilled jobs were lost as a result of automated technology. However, the study also found that automation was responsible for the creation of 3.5 million new jobs; jobs that paid an average of $13,000 more per year than the ones that were lost.[8]

That’s great, but now that we’re going past simple automation, and are entering the new world of Ai, how will this emerging technology affect jobs?

Well, we’re not exactly sure yet.

But…

Insight Global, a job staffing agency, says there are at least three very positive effects Ai will have on the workforce.[9]

  1. Increased Productivity and Efficiency: Employees are equipped to work smarter, which helps them do more in less time.
  2. Increased Overall Business Revenue: When businesses can get more done in less time, they can increase their margins.
  3. The Ai Job Market: Artificial intelligence is expected to create 97 million new jobs.

This sounds quite a bit like what happened after Ford introduced the assembly line, doesn’t it?

So, while artificial intelligence will, in fact, replace many mundane human workforce jobs/tasks, and perhaps replace some more difficult ones, it will almost certainly lead to the growth of new jobs and new industries.

You see, Ai is not only here now, but if properly developed and regulated, it could also lead to a very prosperous future for us all.


The $70 Billion Market

A recent research report by Dimension Market Research says the artificial intelligence in FinTech market will reach a global valuation of $17 billion by the end of 2024.

However, it’s forecasted to reach a valuation of $70.1 billion by 2033. The market will be enormous.

Now, while the research shows the use of Ai in the Fintech market is quite encompassing, our purpose here today is to talk about Ai incorporated into investing tools.

For this, we go back to the Google machine.

A quick search of “Ai stock market tools” reveals hundreds, perhaps thousands of results. And among these results you’ll find dozens of articles about how Ai can beat human stock pickers at our own game. Many of them are an eye-opening read.

But why can Ai beat us at stock picking?

Well, simply put, Ai is better, faster and more accurate at data analysis than we are… and it has no emotional attachment to its picks.

This is why SentimenTrader, a supplier of professional-grade research and investment tools created for institutional, professional and retail investors has custom developed an Ai-based stock scanner.

Now, what does the SentimenTrader Ai stock scanner do?

Well, as SentimenTrader itself says, “It’s engineered to minimize the time spent hunting for data-backed gem opportunities in the stock market.

Designed for efficiency, this tool zeroes in on promising stock opportunities by analyzing over 1,500 S&P stocks (and counting) each day after market closure, presenting users with in-depth back test reports and actionable insights.”

How does it work?

Reinforced Learning: It adapts and fine-tunes back testing parameters for precise trading signal detection.

Recommendations: It equips traders with data on optimal stop-loss, take-profit, and holding durations, ensuring an edge in decision-making.

Why it matters…

The edge. Any edge that could help lead investors to better decision-making and potentially better stock market returns is an edge worth having.

And that edge is our future.

Now, we have no testimony from Archytas of Tarentum about the future…

But as Henry Ford once said, “One who fears the future, who fears failure, limits his activities.”


[1] Ford Production (mtfca.com)

[2] About the USA (usembassy.de)

[3] FordModelT.net – For Model T Owners & Enthusiasts

[4] About the USA (usembassy.de)

[5] Ford Production (mtfca.com)

[6] How Businesses Are Using Artificial Intelligence In 2024 – Forbes Advisor

[7] Will robots and AI take our jobs? – CBS Boston (cbsnews.com)

[8] Automation Replaced 800,000 Workers, Then It Created 3.5 Million New Jobs – Foundation for Economic Education (fee.org)

[9] How AI is Impacting the Job Market (insightglobal.com)

Sweating Under a Buttonwood Tree: A Brief History  of Self-Directed Investing

Sweating Under a Buttonwood Tree: A Brief History of Self-Directed Investing

On a cool, late spring morning in 1792, two dozen stockbrokers sat in the shade of a buttonwood tree outside of 68 Wall Street, sweating.

Now, it may have been a lovely morning, but these “upstanding” fellows weren’t there to enjoy a cup of tea and good conversation, or to brag about how large their commissions for the month were.

No. These twenty-four stockbrokers gathered there to solve a big problem. Perhaps it was a self-created problem. A problem that, if not quickly remedied, could mean the destruction of their careers and the end of the US financial system as they knew it.

You see, just two months earlier, widespread panic began sweeping through the markets.

This panic, not all that unlike others to come, was triggered by rapid credit expansion, stock speculation, unscrupulous backroom brokering, bank runs and massive insider trading.

Nothing like this had happened before, and it led to our young nation’s very first financial crisis.

And…

Over the course of just a few short weeks, the price of US securities plummeted about 20%, as fear engulfed the system.[1]

Clearly, this event was devastating for our nascent economy, and shattering for those who once held confidence in our markets.

But luckily, although fortunes were lost, the crisis was short lived.

Thanks to Treasury Secretary Alexander Hamilton, who quickly stepped in and took control of the potentially devastating situation, contagion was averted, and our economy would get back on track.

However, although full-scale disaster was headed-off by the Treasury, the twenty-four brokers sitting beneath that tree were still sweating.

They knew that if something didn’t change within their “fraternity”, it could all end. All of it. Because if a similar crisis arose again, not only could it destroy our young nation this time…

But their fast-and-loose “practices” may be to blame.

You see, they most certainly knew that without, at the very least, some self-regulation and a solid rule book, their careers and the financial health of the US markets could be in peril.

So, sullen, sulking and sweating in the cool morning sun, they hammered out a document they believed would both help ensure more stable markets and, importantly, the future of their own livelihoods.

Their document read, “We the Subscribers, Brokers for the Purchase and Sale of the Public Stock, do hereby solemnly promise and pledge ourselves to each other, that we will not buy or sell from this day for any person whatsoever, any kind of Public Stock, at a less rate than one quarter percent Commission on the Specie value and that we will give preference to each other in our Negotiations. In Testimony whereof we have set our hands this 17th day of May at New York, 1792.”[2]

This is the Buttonwood Agreement.

It’s an 84 word “founding document” that helped ease us out of a crisis of confidence, forever altered how the U.S. capital markets operated, kept the brokerage business alive, and set rules upon how the “fraternity” conducted its business…

And, it led to the establishment of the New York Stock Exchange.

Now, since the crash of 1792, the subsequent actions of Alexander Hamilton and the formulation of the Buttonwood Agreement, our US markets and its operators have been responsible for the creation of untold trillions of dollars of wealth.

Today, our capital markets and their operators are the most successful and well-regulated on earth, and Wall Street has become accessible to just about everyone.

But for many of us, much of the “fraternity” is becoming a largely unnecessary relic of the past.


Enter The Self-Directed Investor

Way back in the early 1980’s, in Palo Alto, California, a physicist and inventor named Bill Porter had a fantastic idea.

This foresighted genius had already created an “online” securities quoting service called Trade*Plus, which provided quotes to Fidelity, Schwab and others. But he noticed something quite striking about what was happening all around him; the widespread adoption of the home PC.[3]

Realizing that someday everyone would have a computer at their fingertips, and the internet would indeed be “a thing”, he began wondering why he had to pay brokers hundreds of dollars in trade commissions, when he thought that he could make the trades himself, right through his own home computer…

Saving a lot of time and money.

So, with foresight in mind, he developed E*TRADE securities. It was one of the first all-electronic brokerages offering online trades directly to investors, at far lesser commission rates than traditional stockbrokers.

In 1992, almost 200 years to the day the Buttonwood Agreement was signed, E*TRADE became available to retail, self-directed investors; this was undoubtedly a seminal moment in investing history.

Right now, practically anyone with a smartphone and an online brokerage account can access US markets and self-direct their own investments.

And thanks to these tools, self-directed investing has become a massive part of both daily trade and daily dollar volume.

In fact, the self-directed, or retail investor market now makes up over 20% of all daily volume, with self-directed investors having surpassed over $7.2 trillion in trades.[4]

The world of investing has, clearly, drastically changed.

You see, because of computers, the internet, people like Bill Porter, and the availability of well researched and actionable information and trade ideas, many investors may no longer need stockbrokers or big banks to make investment choices for them.

Now, online brokerages still make commissions on trades today (some brokerages offer zero commission trades), and registered financial advisors are still needed, but as evidenced by the massive trade volume of retail investors, many self-directed investors no longer believe they need the advice, or stock ideas coming from “the pros.”

Instead, they seek and consume independent, well researched and actionable investment ideas they can trade on, by themselves.

And because of the democratization of information, and platforms like SentimenTrader, those ideas have become the cornerstone of successful, self-directed investing.

What was once under the control of a few possibly crooked stockbrokers huddled under a buttonwood tree in New York, trying to figure out a way to save their careers (and markets) …

Is now in control of us, the self-directed investor.

Of course, financial professionals and advisors are still an integral part of our markets, and many do offer some valuable advice and products…

And tons of folks rely on them.

But you may be surprised to know that because of well thought out and actionable research (like that available at SentimenTrader) …

Even professionals obtain and consume some of the very same ideas that are available to self-reliant, self-directed investors.

In fact, if you look at the testimonials of SentimenTrader subscribers, you may notice that some, if not many of the testimonials you’ll read on their website, come not only from self-directed investors…

But from Wall Street pros.

Which begs the question…

Why do Wall Street professionals use tools like SentimenTrader?

Well, why wouldn’t they?


[1] alexander_hamilton_central_banker.pdf (nyu.edu)

[2] sechistorical.org/collection/papers/1790/1792_0517_NYSEButtonwood.pdf

[3] Sidebar: A Brief History of ETrade | Computerworld

[4] From the Mailbag: ‘How does TiiCKER Create Community?’ | TiiCKER

Why Most Self-Directed Investors Lose Money… A Lot of Money

Why Most Self-Directed Investors Lose Money… A Lot of Money

If you had just a 10% chance of being successful at skydiving, would you jump?

Let’s not be ridiculous, of course you wouldn’t.  You might not even jump if you had a 99.998% chance of landing safely, which you do.

Now, think about this…

Would you buy a stock if you knew you had just a 10% chance of making money with it?

Of course you wouldn’t. Or at least you shouldn’t.

But chances are, if you’re the type of retail, self-directed investor we’re about to talk about, you’re going to go ahead and do it anyway.

You see, there are a lot of losing traders out there. A whole lot of them. In fact, it’s estimated that only 10% of self-directed investors actually make money trading in the stock market, while 90% lose money.[1]

With over 63 million Americans owning a retail brokerage account, that’s a whole lot of losers.[2]

So, why do so many self-directed investors end up losing more money than they make?

Well, recent history can teach us a lot about why.

During the pandemic, an estimated 16 million Americans got bored, opened a brokerage account and became first time stock traders. Genius stock traders, many would claim.

As you recall, the roughly 21-month long bull-market that occurred during that time resulted in the S&P 500 returning investors over 114%.[3]

That’s almost 13 years of traditional 9% returns crammed into a few short months.

The market was so hot that almost everyone was making money back then…

Toss a dart at a ticker and it went up.

But like all good things in life, it didn’t last forever.  By the time the spring of 2022 rolled around, the bull market turned into a bear market, and those “genius” first time retail investors got ground up and spit out by smart money.

Which brings us to why?

Today, just like in 2020, many self-directed investors chose their investments/trades based on what others are doing, rather than searching for diamonds in the rough. I.e., they don’t conduct much due diligence, if any at all.

And research? Forget about it.

Retail investors hear about the huge up-trend in stock X, and how everyone is getting in on it… and then they too follow suit by going in heavy.

And we all know how this scenario ends.

Of course, trend trading can be very fruitful, but you have to know what you’re doing, and you must have the proper tools that can help with measuring true market sentiment – tools like smart money uses.

But without the right sentiment and timing tools, many retail investors find themselves overexposed when the market takes a quick turn, and they end up losing their shirts (more on this in a minute).

Now, following the crowd and being late to the party isn’t the only reason so many retail investors lose. A huge factor in investor losses comes down to greed. Like we said earlier, during the pandemic bull market you could basically pick a winner from a hat.

Because so many stocks rose so quickly, a “get rich quick” theme emerged among retail investors.

Especially those who followed social media “stock gurus.”

Dave Portnoy, from Barstool Sports, famously said in June of 2020, “Say it with me… Stocks only go up. Only losers take profits.”[4]

People believed him.

The “get rich quick” mentality has also led to retail investors over-trading, chasing play after play, having no patience and foregoing long-term profit potential for short term gains.

This leads to booking gains too fast (you need capital to keep “playing”) and holding onto losers too long; with the belief they’ll eventually turn around… even if they’re down 30, 40, 50 percent or more.

Unfortunately, those losers end up outweighing the winners, hence the 90% loser rate.

Clearly, this is the very opposite approach most professionals take, where winners are left to run, and losers are cut quickly.

Sorry Mr. Portnoy, not all stocks go up.

Now, there are a whole lot of other reasons why retail investors often end up on the losing end of a trade. But the most pervasive reason is a likely a complete lack of due diligence, a complete lack of intelligent market research…

And a resistance to using professional-level tools designed to help gauge real market sentiment and to help assist in market timing.

It seems most retail investors simply don’t want to put in the work.

Now, we mentioned earlier how without the proper sentiment and timing tools, many retail investors can get caught overexposed in a market turn, are late to the party when it comes to sentiment swings…

And end up shirtless.

This is why smart money has been using SentimenTrader for so long. You see, the professional-level tools that SentimenTrader offers is believed by many to give a serious edge over dumb money.

In fact, a quick review of their website shows the vast majority of those who’ve commented on its products are, in fact, investment professionals. Aka, smart money.

But…

Unfortunately, only a portion of SentimenTrader’s users are retail, self-directed investors.

Why?

Perhaps too many retail investors believe it’s “too much work” to get SentimenTrader (it’s not) …

And they aren’t aware of the edge that SentimenTrader could be offering to smart money…

Is actually available to them too.


[1] 90% Retail Investors Lose Money – Rediff.com Get Ahead

[2] Must-Know Brokerage Account Statistics [Current Data] • Gitnux

[3] A History Of U.S. Bull Markets, 1957 to 2022 – Forbes Advisor

[4] (1) Dave Portnoy on X: “Say it with me… Stocks only go up. Only losers take profits. #DDTG https://t.co/PEqS7igaAf” / X (twitter.com)

Can You Beat Hedge Funds… All By Yourself?

Can You Beat Hedge Funds… All By Yourself?

$10,000 suits, 200-foot yachts, private jets, and ownership in professional sports teams. If this sounds like a lifestyle you’d want to enjoy, and it probably is, you should consider becoming a billionaire hedge fund manager. One of the glamourous, “smart money” titans of Wall Street…

You could make an absolute killing.

Take Steve Cohen, for example. He’s the Founder, Chairman and CEO of Point72 Asset Management, one of America’s largest hedge funds.

According to Forbes, Mr. Cohen, who also happens to be the owner of the New York Mets, has a personal estimated net worth of $19.8 billion.

In 2023, his fund returned 10.6%…[1]

That’s not bad considering the 20-year average return for the S&P 500 is about 9.69%.[2]

His investors must have been thrilled.

But beneath that expensive private jet veneer and “market beating” return lies something a bit, well, odd.

You see, while hedge fund managers are seemingly fantastic at making money…

They aren’t really all that good at generating returns for their investors. In a moment, we’ll explain why.

But first, according to Citco’s 2023 Hedge Fund Report, the hedge fund industry averaged total returns for investors of about 14.66% last year.[3]

In a “normal” year that may seem quite good considering the long-term average returns of the S&P 500.

However, total returns for the S&P 500 last year were 26.29%. That was nearly double the return of the average hedge fund, and well over double the returns of Point72.

And 2023 was not an outlier.

The American Enterprise Institute looked at hedge fund performance from 2011-2020. They found that typical hedge fund underperformed the S&P 500 “every single year.”[4]

So why is it that a hedge fund’s typical returns do not beat the market, yet hedge fund managers are referred to as “smart money”?

Simply put, they’re smart enough to make money for themselves.

And they make that money… hand over fist.

See, it all comes down to exorbitant fees called the “two and twenty.”

When an investor signs on with a hedge fund, and invests let’s say $100,000, 2% of that $100K immediately comes off the top, leaving the account worth $98,000.

The account is already in the hole before any investment is made.

And, that 2% is an annual management fee. Meaning that at the turn of the next year, the investor will be charged 2%, once again.

Now, with that starting account value at $98,000, every single penny in profit (depending on the agreement) is charged a 20% performance fee.

This means that if the investors account increases by 10% (roughly the average return of the S&P 500), the account would be worth $107,800 (a $9,800 gain) …

Except for those “performance” fees.

When those fees are backed out, that $9,800 drops to $7,840.

Doing some quick math and you’ll see the investor made 7.8% on their money…

While the hedge fund made almost 4% on, well, not their money.

This is what makes hedge fund managers “smart money.” So long as their investors stay invested, they make money.

Clearly, a hedge fund wants to beat the market. Who doesn’t.

But hedge funds aren’t as incentivized to beat that market as you, or I are. You see, no matter what happens (so long as investors stay invested) hedge funds collect at least that 2% management fee…

And don’t ever pay out an “underperformance” fee.

Smart, for them. Not so smart for their investors.

So, how can a self-directed investor beat the average hedge fund?

Well, let’s assume that $100k account again, but this time you’re investing on your own so there’s no “two and twenty” fees.

We’ll use last year’s S&P 500, as well as last year’s average hedge fund returns as an example, as we cannot predict with any degree of certainty what will happen this year (nobody can).

Let’s assume that with your $100k, you invested 50% of it in the S&P 500, reinvesting dividends. That $50k portion of your portfolio would’ve been worth $63,145 at years’ end (less those small transaction fees).

Now, let’s say you invested the other half of your $100k into single stocks. You read some great research reports (like those from SentimenTrader), understood the market cycle and made your picks.

Maybe you hit some homeruns, and maybe you had some serious duds (never listen to the checkout guy at the grocery store), and your performance on that $50k ended up being half the return of the S&P 500 (13.15%).

That portion of your portfolio (less small transaction fees) would have ended the year at $56,575.

In total, between your S&P 500 portion and your single stock portion (with your single stocks lagging the S&P by 50%) …

Your total account value would’ve been about $119,720, a 19.7% total return…

All without the two and twenty, and you’d have beaten the average hedge fund by 34%.

Of course, every year will be different, but historically speaking, so long as you have well researched and actionable information, and you make some “safe” money plays…

You can beat hedge funds as a self-directed investor… and if more of the single stocks “hit” … you could crush them.

But owning a sports team?

You’ll need to collect those two and twenties.


[1] Hedge fund 2023 returns roll in, including Citadel, D.E. Shaw and Point72 | Pensions & Investments (pionline.com)

[2] Historical Average Stock Market Returns for S&P 500 (5-year to 150-year averages) – Trade That Swing

[3] 2023 Hedge Fund Report – A Year in Review – Citco

[4] You Can Shred the Average Hedge Fund by Doing Basically Nothing. Here’s How. (yahoo.com)