
Rejoice investors, there’s no bloodbath coming (or is there?).
The first half of 2024 has been nothing short of spectacular. The S&P 500 hand-fed investors total returns of over 15%, with the tech heavy NASDAQ doling out nearly 18%.
That’s 15-18% in just a six month span…
All while wars raged across the globe, inflation remains “sticky” at home and abroad, the US government seems to continue spending more money than it can print…
And the FED holds interest rates steady at two-decade highs, waiting/pushing for employment numbers to crack.
Tough times, yes, but very good returns, nonetheless.
Now, while 15% returns over six months may not seem so great for a single hot stock, and it’s not, it is, however, spectacular for an index.
Take the S&P 500’s first half total returns this year, for example. They were over three times greater than the historical average returns of 4.72% since 1953.
And that’s plenty of reason to rejoice, right?
Hmm.
Of course, much of 2024’s first half gains can be attributed to just a handful of heavyweight single stocks; the “magnificent seven.”
Apple (AAPL), Microsoft (MSFT), Alphabet (GOOG), Amazon (AMZN), Nvidia (NVDA), Meta Platforms (META) and Tesla (TSLA).
But…
Like all good things, this bull run must come to an end, and it may come to an end with a fast and violent correction.
Now, we’ve already seen the cracks start to form in the wings of at least one highflier, Nvidia. The stock closed out the first half with near 150% returns… yet began to slip by mid-June; having quickly and violently shed over 13% from its highs.
Yahoo! Finance said, “Nvidia suffers biggest loss in world history after $646 billion bloodbath: ‘This is a concern’”
Investor’s Business Daily went as far as to say, “Will Nvidia Stock Crash Like Cisco In 2000?”
MarketWatch said, “The S&P 500 and its biggest stocks are showing cracks and fissures”
Now, we don’t know if small cracks and fissures will turn into Grand Canyons…
But there is reason for great concern.
See, in the S&P 500 ETF Trust (SPY) just seven companies make up 32.26% of its holdings… yes, the magnificent seven.
Should the cracks that are already appearing turn into something more serious, we could be on the verge of correction. In fact, a correction in just these seven stocks, at the same time, could crush the indexes… and all the other stocks in them.
Now, how do we know with any degree of certainty that a correction, or perhaps a bear market, is on the horizon?
Well, for this, we need to fully understand market indicators and market sentiment.
Yield curves, credit spreads, sector rotation, valuations, technical patterns and transitions…
Geopolitics, economics…
Interest rates…
The list goes on and on.
However, there has been at least one indicator that’s been historically quite accurate at predicting bear markets… and ironically, it’s what Wall Street seems to be wanting.
Rate cuts.
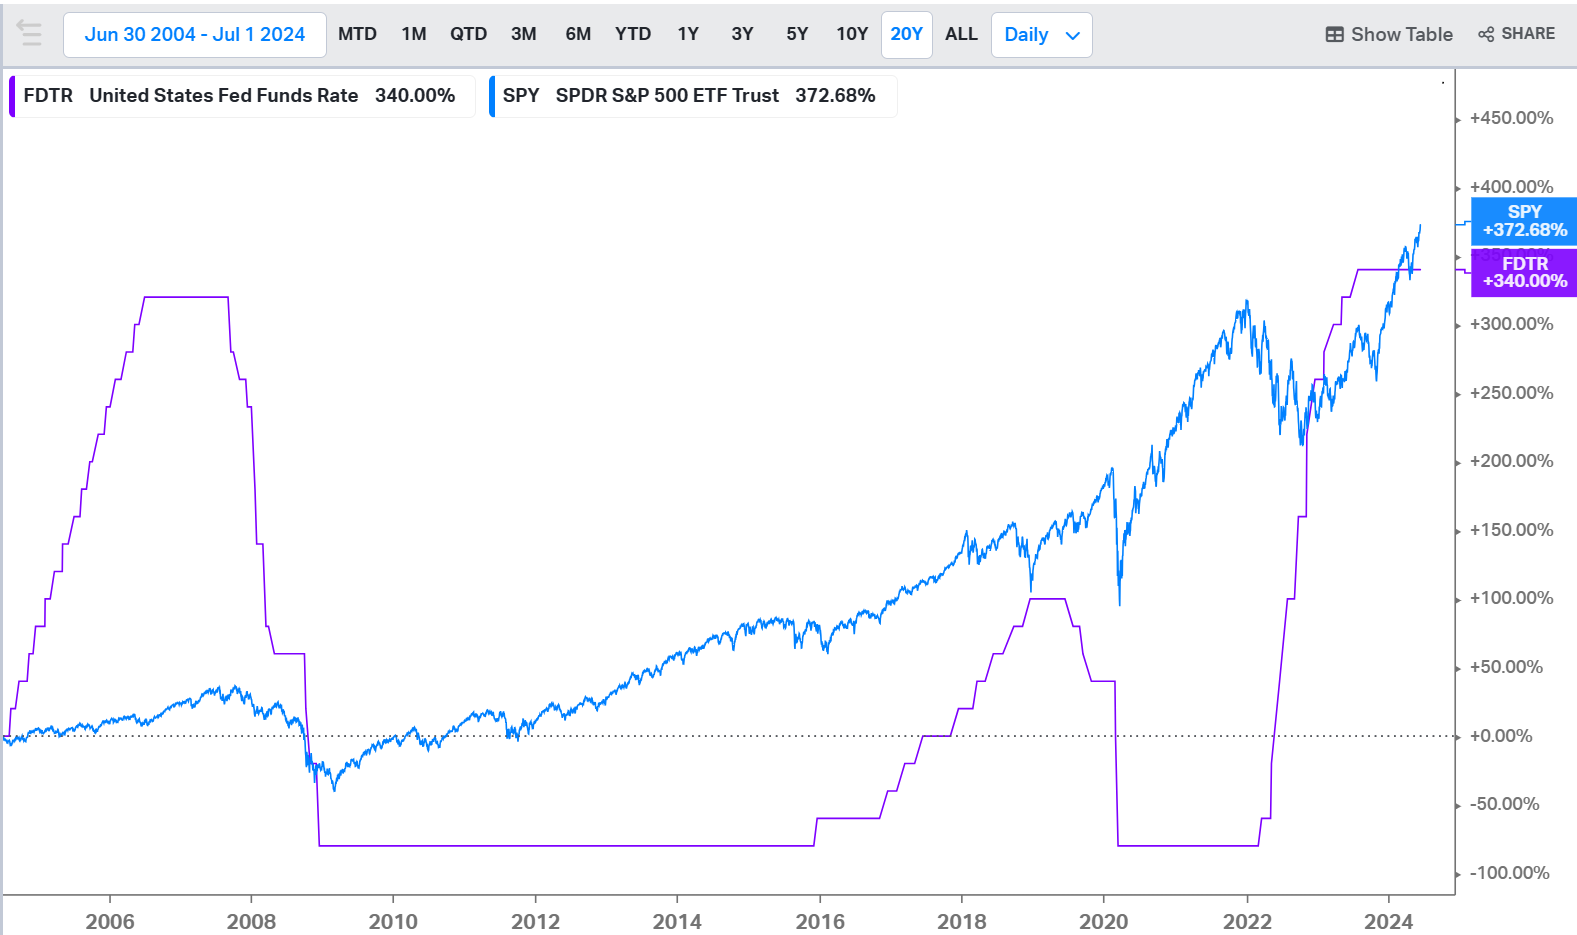
Have a look at this chart.

This is a 20 year chart of the SPY with the Fed Funds Rate overlay. And here’s the irony…
As you can see, each time the Fed began a rate cut cycle (as Wall Street cheered), the SPY tumbled.
And…
With the potential for rate cuts coming later this year, investors should be preparing themselves in the event of a bear market, and perhaps a recession.
See, each time a major rate cut cycle has begun, recession has followed. The purpose of a rate cut, after all, is to stimulate a weakening economy.
Now, the Fed knows history. It knows what has happened in the past and is desperately trying to buck the trend. It’s why we keep hearing the Fed is aiming for a “soft landing.”
Meaning it can manage interest rates effectively, without triggering recession.
But can the Fed achieve its goal this time?
We simply don’t know yet. However, you should be prepared. Prepared for a correction, a bear market or even a continuation of the bull market. Be prepared for everything.
There is no reason to stay in the dark.
So, what’s the best way to prepare for “everything”, you ask?
You see, with over 3,000 proprietary indicators and charts, SentimenTrader has been a preferred market and research tool for Wall Street professionals for over 20 years.
Those twenty years span that entire SPY/Fed Funds rate chart shown above. And throughout these 20 years, SentimenTrader has been atop of, and often ahead of every move.
It’s why Wall Street trusts it. And it’s why you should too.
See, even though SentimenTrader is preferred by Wall Street, it isn’t for Wall Street professionals alone.
It’s also for self-directed investors and traders.
If you’re looking for an edge, an edge already enjoyed by Wall Street, you too should subscribe to SentimenTrader…
And subscribe today.
