
Turn on any cable news channel and you’ll be told, ad nauseam, that this is the single most important election in US history.
If candidate A doesn’t win, democracy is over…
If candidate B doesn’t win, the economy will be in shambles.
And your money? You can kiss it goodbye because X, Y, and Z will happen. It’ll definitely happen…
Fear sells.
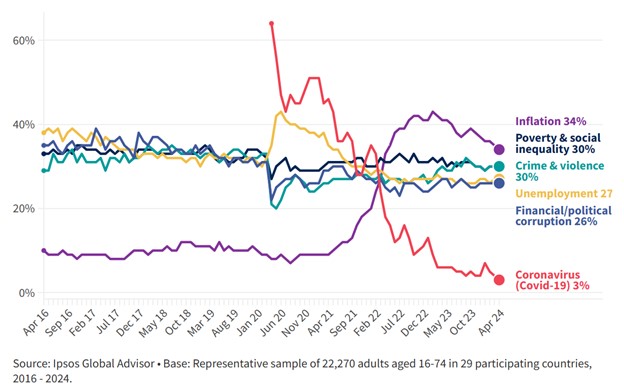
Have a look at this chart…

This chart, from Ipsos, shows various “fears” expressed by adults from 29 different countries. It spans nearly a decade, and it covers three US presidential election years, including this one.
With the exception of inflation, Coronavirus and its employment impacts, global fears have remained remarkably steady.
Now…
A strong case can be made that the widespread fear (campaigned on) during the Coronavirus election year led to the change in political control over America’s executive branch in 2020.
And a case could be made that widespread fears over inflation (campaigned on) could lead to another change in political control over our executive branch, this November.
Time will tell.
But even though fear can almost certainly sway voters in an election year…
Does the stock market care about elections, or election years?
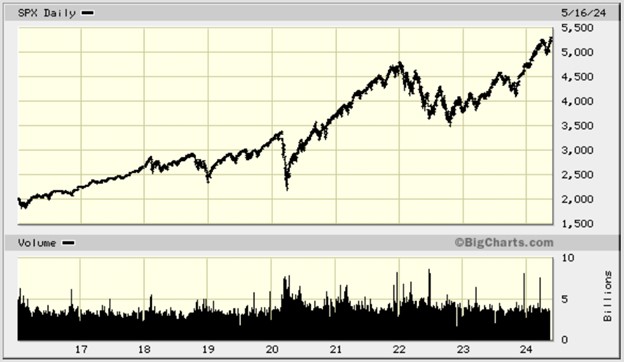
Have a look at this chart. It’s the S&P 500 covering the exact time period as the Ipsos fear chart.

Again, this covers almost ten years, with three of these years being election years.
During this timeframe, the S&P 500 gained over 140%.
Of course, this 3-election-cycle timeframe does not give us enough data to draw any sort of conclusions on whether the market cares about presidential election years, or not.
For that, we need more single-year data, and more time. So, let’s have a look.
Since 1928 there have been 24 presidential election years, excluding this one.
In 83% of those election years, stocks ended positively.
During the first half of each election year (which we’re in now) the market averaged a 2.78% gain.
During the second half of the election year, the market averaged a 9.34% gain.
Overall, the S&P 500 has returned an average of 11.57% during election years.
That’s pretty good, right?
Of course, the data is “averaged” over the course of 24 election years, so some years are better than others…
And because we’re averaging 24 years of gains and losses, it makes sense that the stock market’s performance is roughly in line with just about any other, ordinary year.
There are, however, some big outlier years.
Take for example, the election year of 1928, the S&P 500 gained 43.61%.
And let’s take the election year of 2008, the S&P 500 fell by 37%.
The market in both of these election years, you may recognize, was driven by economic and investor sentiment factors, and not by political hyperbole.
So… with 24 (going on 25) years of presidential election year data, we have enough information to reach an educated conclusion:
On average, during an election year, the market is… on average.
And the stock market doesn’t care about presidential elections.
Presidential Election Years Have Been Good for Investors (hartfordfunds.com)
How Presidential Elections Affect the Stock Market | U.S. Bank (usbank.com)
What does the election mean for the stock market? | Fidelity
